How To Take Notes Using The Charting Method
Charting Method
On one sunny peaceful day, when I was minding my own business and watching YouTube videos I stumbled upon this: How To Take Notes With The Charting Method. The video got me to think more about this method, so I decided to see how effective it really is.
While it does seem like a good method to organize your notes in a really simple way, I didn’t have all that high expectations of it.
The reason?
If you need a simple way to organize your notes you should use mind maps. But, this method did peak my interest so I decided to give it a try and see what it’s all about.
So what are the results of my so-called analysis?
Far better than expected (I didn’t have many expectations, keep that in mind)! The most important thing is that it can be a good alternative to mind maps. If you don’t like to make mind maps then this method might just be for you.
Table of contents
- How does the charting method work
- Where to make the table
- How to start
- Filling the table
- How to study using the notes you made
- How to study using the notes you made – active recall edition
- Mind Maps VS Charting Method
- Final thoughts
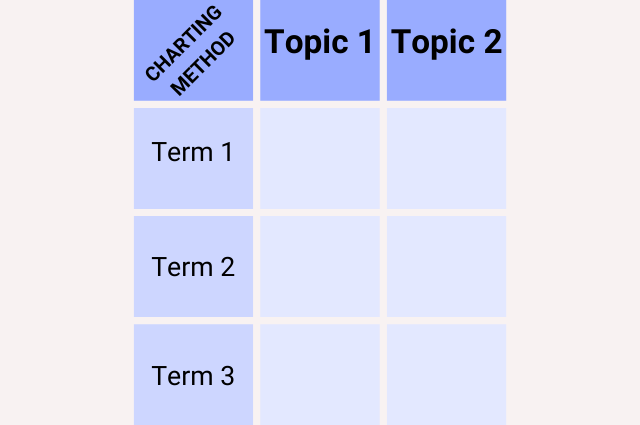
How does the charting method work
Before we get started let me show you what notes made with a charting method even look like.
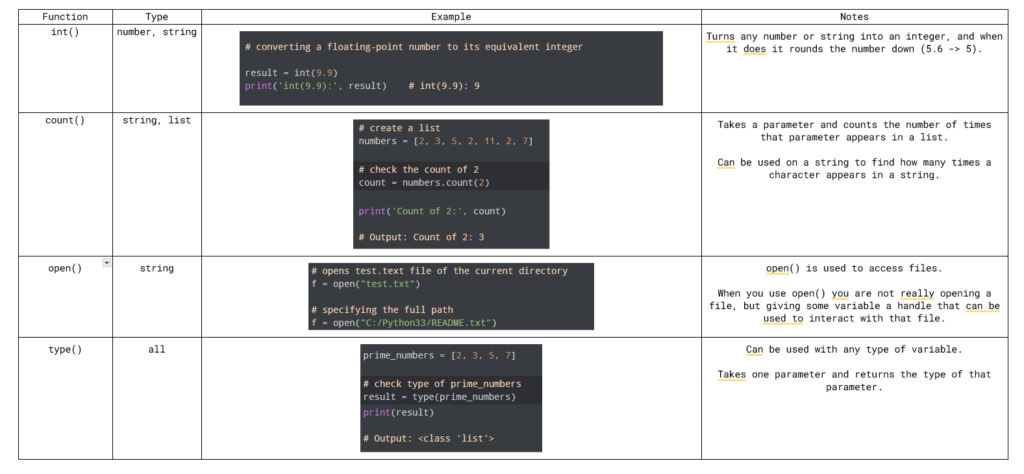
Here is what a part of my Python charting notes looks like (I am not about to post more than 10 screenshots just so you can see the whole thing). Maybe Python wasn’t the best thing to use to demonstrate these notes, but that is practically the only thing I have been learning for the past month, so it’s the only thing I have (take it or leave it).
Not to worry though, you can still get a sense of how this method can be of help to you. As I said before, the charting method is used to make your notes easier to understand. To achieve that, you need to make it easy to read your notes.
Better yet, make it so you need just a few glances to understand what is going on.
Now, let’s see how you can learn to make charting notes too.
Where to make the table
As you can see, the carting method relies on a table to make the notes simple. You can always make the table by hand, with a pen and paper, but these days that would take too much time. Instead, you could use some of the digital apps to make a table for you, such as:
- Microsoft Word
- Microsoft Excel
- Google Docs (the one I used)
- Google Spreadsheets
- Notion
There is not really all that much difference between all of them (at least when it comes to the charting method), so pick the one you are the most comfortable with.
How to start
First of all, pick the material you are going to make notes on. After that, you need to pick what you are going to put in the table you make. Take a look at the four things I picked:
- The function I am trying to learn – The function column
- What type of variable that function is used with – The type column
- An example to make it easier to remember – The example column
- And some thoughts that could be of help to me – The notes column
You need to pick the things that are relevant to the material and put them together in the table in a way that is easy to remember.
Let’s say that you are a medical student and that you just learned about kidney disease. You could make a table with columns like causes, symptoms, treatment and so on.
No matter what material you are studying, I suggest that you leave one column for some thoughts you have about that part of the material (like the notes column in my example). Write something that would make it even easier to understand/remember the notes you are making.
Just remember that those are notes, so don’t write a whole essay every time you add a new term to the table.
(for those who are wondering why the Example and Notes columns are so big, and why Function and Type columns are so small, that is because I already know that Function and Type columns won’t take more than 3 words, while the other two columns need a lot more space)
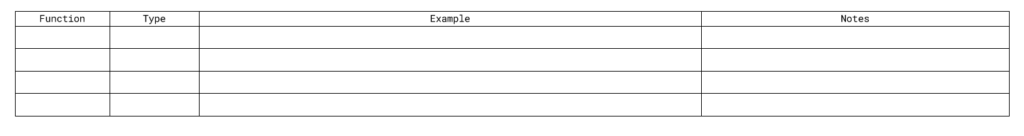
Filling the table
The next thing we need to do is put the important stuff in the table (you couldn’t have guessed that, good thing you have me around).
Obviously, you know that you need to fill the table, so why would I waste your time with this step?
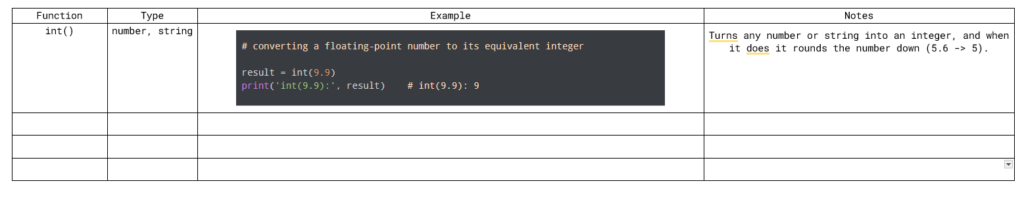
When I say to fill the table, the first thing that comes to mind is to fill it with words. But that is not the only thing we have at our disposal. When I was making my charting notes, I could have written everything with words and used nothing else.
Instead, in the third column, I used pictures instead of words (which were taken from here, for anyone curious). When you are learning to program, it’s much easier to think if you are looking at the console, instead of words, even if they look the same (I don’t know if this is just the case for me, but when I tried to learn programming from a book, I couldn’t look at the code, it somehow just felt wrong).
Even if you don’t think that you will benefit much from this, think about other things that can be displayed in a picture that are hard to explain with words.
Trying to remember information about statistics might be easier if you are looking at a chart. Remembering how something works can be easier if you are looking at a picture that explains everything, step by step.
The same thing applies to the notes column. If you can remember something easily just by reading it, that is fine.
But, think about it.
Are there things you could remember easier if you look at a picture that explains them? If there are, use that to your advantage, and make notes that are simple to understand for YOU.
How to study using the notes you made

After you have filled the table, you are pretty much done. Now, the only thing you have to do is to learn what is written there. Since the notes are made in columns, if you want to see how something compares to something else you could just find the two things and compare them.
If you put all of the important information in the table, you just need to look at the two rows and see how they compare.
This is the biggest benefit of the charting method.
It makes it extremely easy to compare two things. Imagine how hard it would be to compare two things if you had to constantly flip through pages to find what you are looking for. Seeing how something compares to something else is a great way to learn the material.
It helps you to see things from a different perspective. Adding some pictures can be a great way to boost that effect.
Although it is true that this can help you tremendously when you are learning the material, there is something else you can do to get the results even faster. By using active recall, you can learn the material even better.
What is active recall and how can it help me?
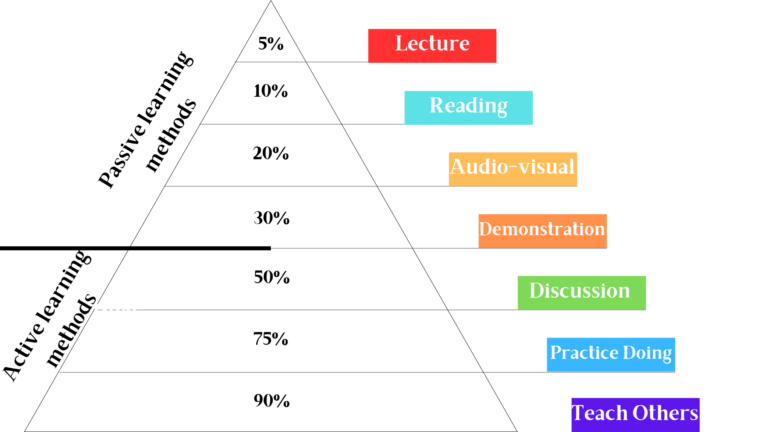
You don’t learn much by reading and re-reading the material, because you don’t engage your brain enough. If you read the material and after every paragraph, you stop to summarize what you read without looking at that paragraph you will remember much more, since you are engaging your brain.
This method of learning is called active recall. If you want to learn more about it, click here. This is the most basic way to use active recall, but you can take advantage of the charting method and use it in another way.
How to study using the notes you made – active recall edition
You don’t have to do anything special to use active recall when learning from notes made with the charting method. Rather than every paragraph, you could use active recall for every row you read through.
Read through one row, then try to recall what you just read. Do this until you get to the end of the table. At this point, you can take a 15-minute break and relax.
This sounds like a nice way to learn, nothing scary is going to happen after this right (that’s definitely not foreshadowing)?
Now, that you are back from your break, you can do the same process again. But if you want to do something more fun, you can open a new document and try to make a whole table from the beginning, to see how much you truly remember.
One problem with active recall is that you can easily cheat by looking at the material you are trying to recall. You could also skip some parts, because “you already know them well enough”.
But this way you don’t get to cheat.
Until you make the whole table you are not allowed to move from that document. The only way is to finish the table or give up. There is no “I just want to look at this one thing”, or “I would have known that if I looked at it one more time” or “It’s my favourite hamster’s birthday so I got distracted” or some other ridiculous excuse.
What you write on that blank document is what you remember.
This helps you to identify what you truly know and what you have to work on some more. You don’t have to remember everything the first time. Keep going until you feel like you know enough.
Mind Maps VS Charting Method
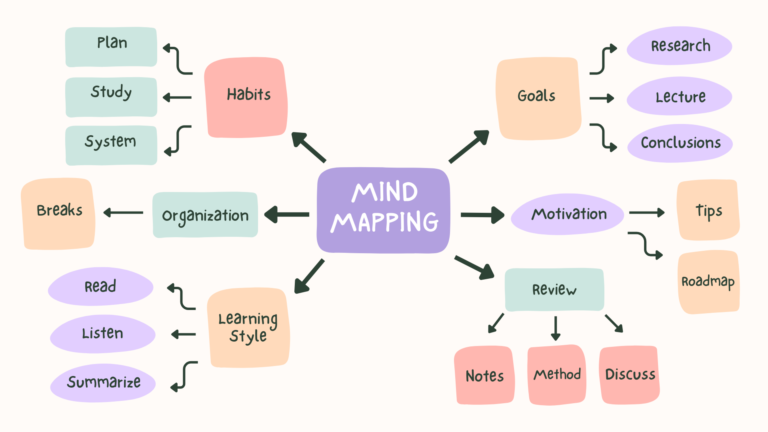
In my personal (although, not always accurate) opinion mind mapping is the best note-taking strategy. Any note-taking method has to be at least somewhat comparable to mind mapping for it to be considered good by me.
In this case, the charting method passes all of its tests and is officially considered a good note-taking method by me (if that means anything to you).
However, just because I think mind mapping is better than the charting method, that doesn’t mean that it is true.
Everyone has a different style of studying. Maybe mind maps really aren’t for you, but you find the charting method ideal and easy to work with.
In that case, good for you!
Stick with what is working for you, and not with what is universally considered the best.
The reason I think mind maps are the best is because of how easy it is to see the big picture and connect the key terms of the material you are studying, and to me, that is the most important thing a note-taking method can provide.
Similarly, if you think that the ability to easily compare the terms in the material you are studying, and see the similarities and differences between them is important, then it’s only natural that you find the charting method as the better of the two.
Final thoughts
The main advantage that the charting method provides is that it is extremely easy to compare two different terms. You just need to find the two terms you are looking for and see what are the similarities and differences between them.
That means that if the material doesn’t have much to compare, the charting method loses its most powerful feature. However, even without that, the way it lets you present the information in such a simple and easy-to-read way is definitely an advantage worth having.
That is why I said that using my Python notes isn’t the best way to use the charting method. You don’t get much out of comparing how different functions work.
But, even without that, it’s been so easy to find how a function works. When I would make a mistake, I could quickly look for the function that caused the mistake and see how it worked.
And, when I forget which function does what (which happens more than it should), I could just look at the notes column and find what I am looking for.
After using the charting method for some time, I can safely say that it is a good method to use. So, the next time you have to organize some information (and especially if you have a lot of things to compare) try to make notes using the charting method and see what results you get.